OPS>TECHNOLOGY>POLARIZED FLUORESCENCE
Polarized Fluorescence
What is imaged ?
Polarized Fluorescence has its origin in the polarized excitation and emission of single fluorophores. In biology, fluorophores are made to bind to target molecules for reporting the presence and organization of specific molecules in cells and tissues. In addition to the chemical specificity due to the binding of fluorophores to target molecules, polarized fluorescence provides structural specificity due to the reporting of a preferred orientation of the fluorophores and their target molecules. As a fluorophore binds to its target molecule, the spatial orientation of the fluorophore and its target become correlated, with the strength of the correlation depending on the rigidity of the molecular linker. As fluorophores become constrained in their orientation, their fluorescence becomes polarized. The Fluorescence OpenPolScope measures and presents images of the fluorescence, its anisotropy and polarization orientation in the specimen.Hardware
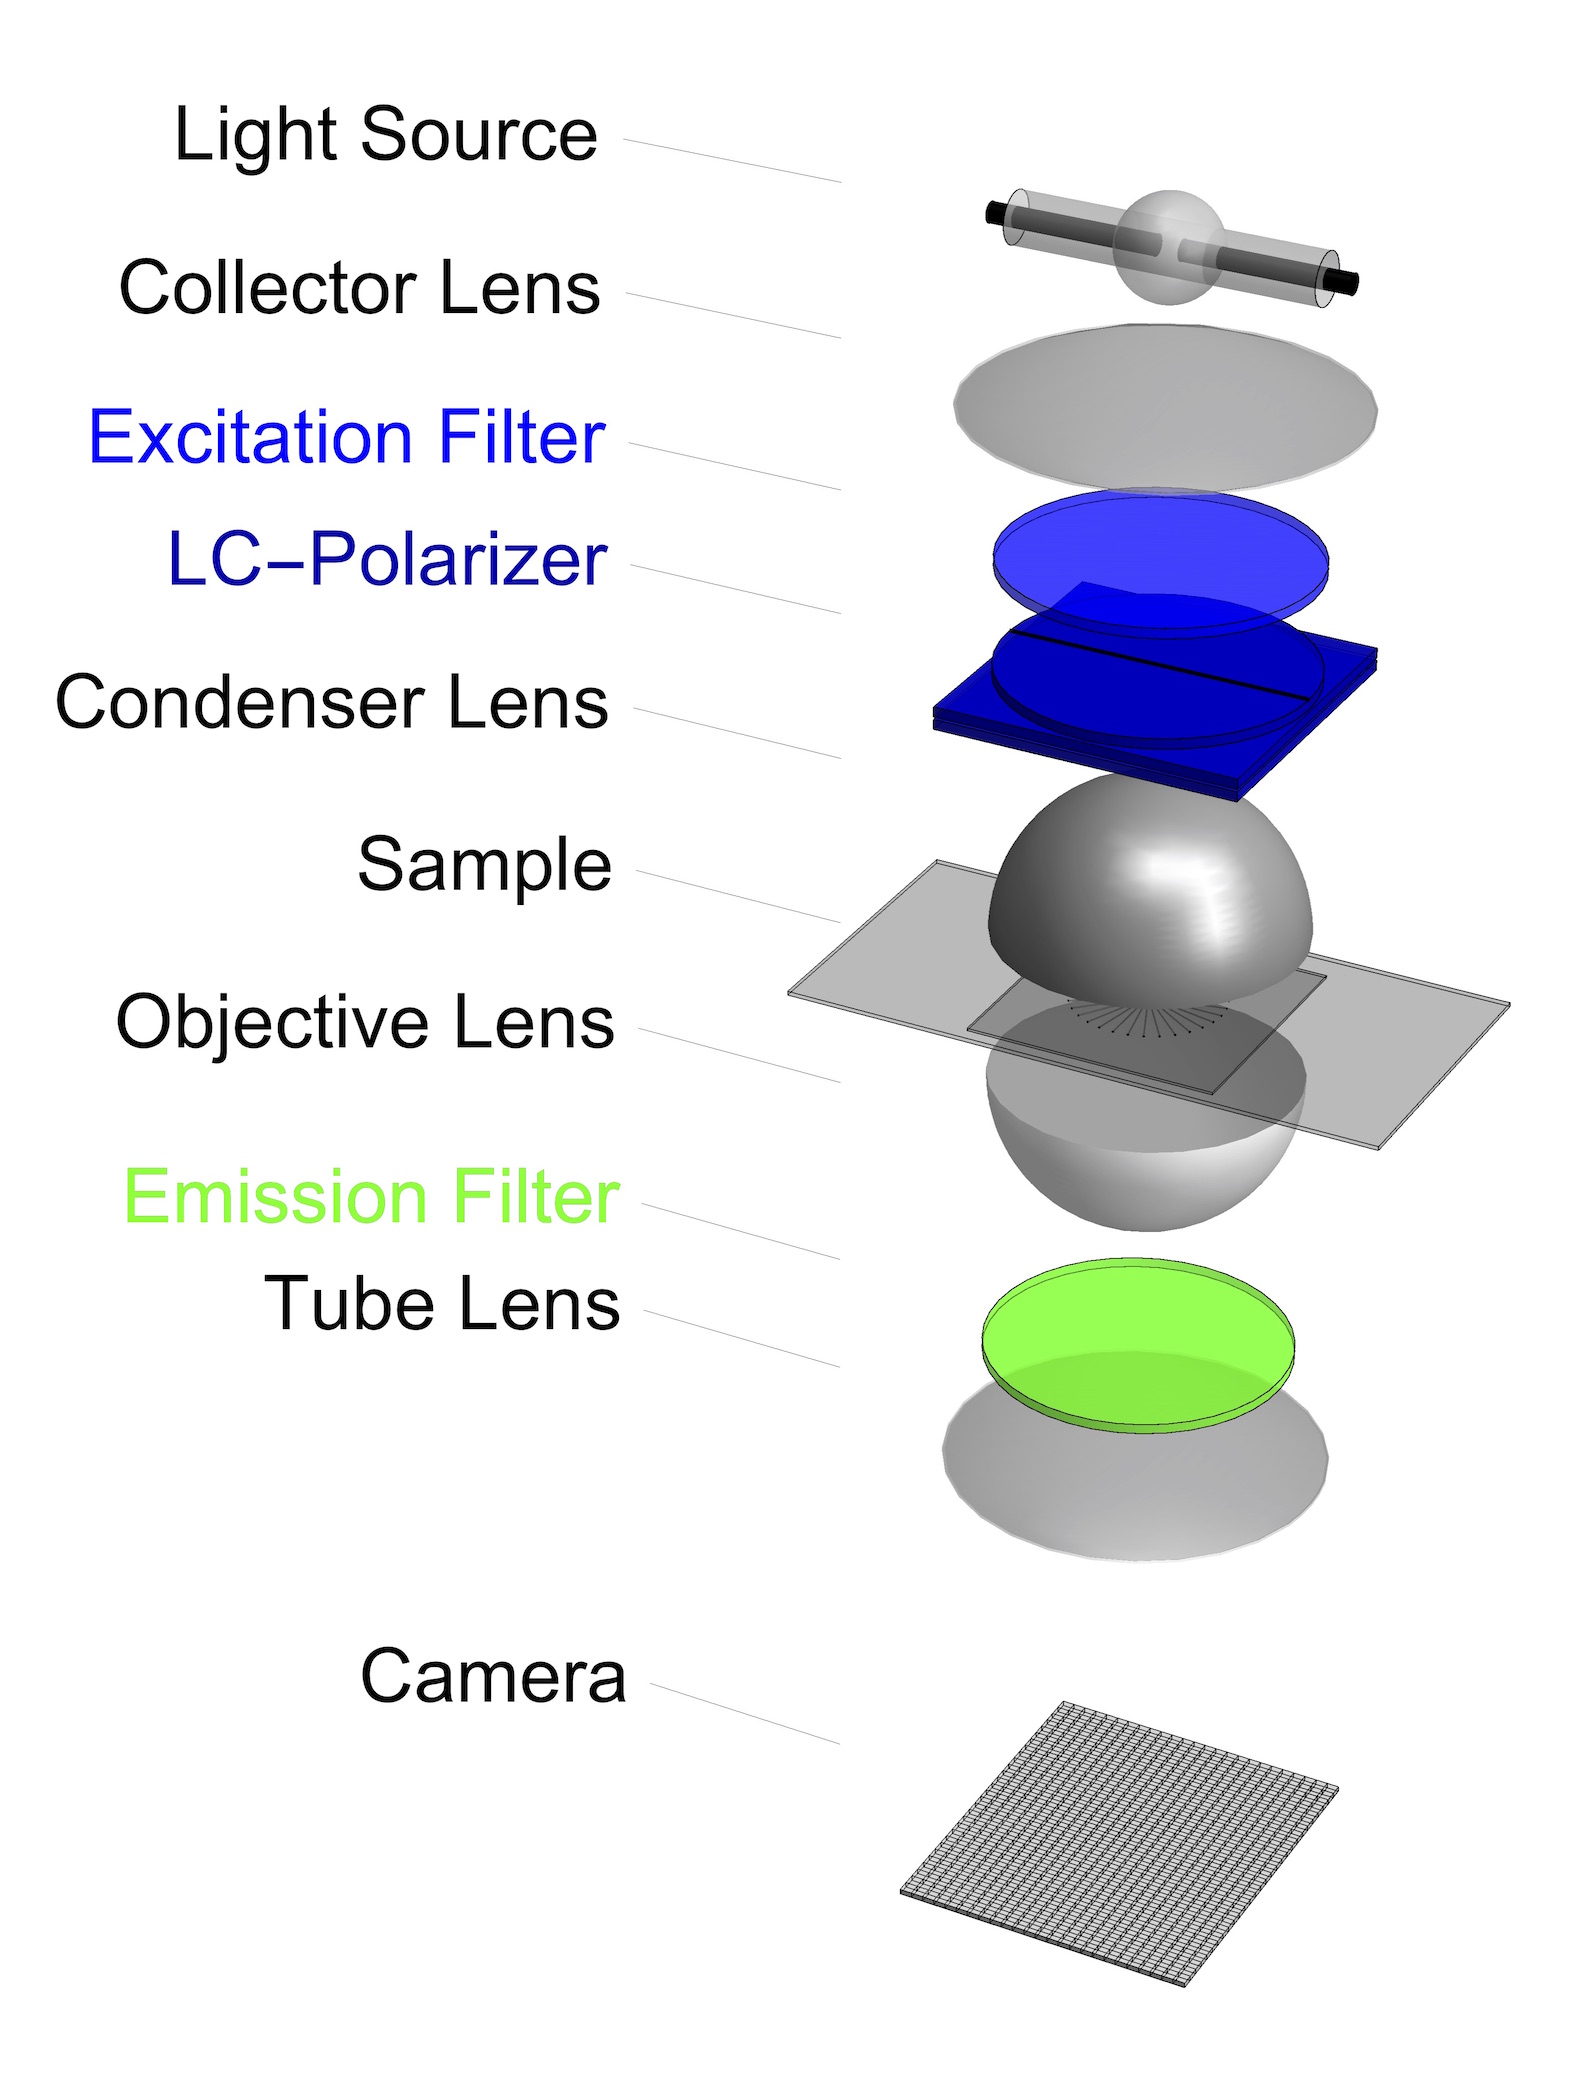
The OpenPolScope augments the traditional polarizing microscope with specific hardware and software components.
Required hardware components (trans-illumination):
General:
Wide-field microscope stand with bright, monochromatic light source, such as a mercury or xenon arc lamp with bandpass excitation filter, bandpass emission filter in imaging path (for GFP fluorescence, we successfully used BrightLine filters from Semrock, as specified in the schematic on the right);
for best results use strain-free
objective and condenser optics;
CCD or equivalent camera supported by
Micro-Manager software;
Computer with Windows 7, ImageJ, and Micro-Manager
installed.
Epi-illumination is also possible, but prone to more polarization aberrations caused by the dichroic mirror in the light path.
OpenPolScope specific: LC universal compensator, or filter wheel with linear polarizers.
The LC universal compensator is made of a linear polarizer and two variable retarder plates implemented as liquid crystal devices. Unpolarized light enters on the side of the linear polarizer and exits as polarized light whose polarization can be set to any state, including circular polarization and linear polarization of any orientation. The LC settings are computer controlled through an electronic controller box.The liquid crystal devices for the universal compensator can be custom ordered from several manufacturers.
Alternatively, a filter wheel loaded with polarizers rotated to the required orientations can be used instead of the LC universal compensator.
The OpenPolScope Group at the MBL can assist in acquiring and optimizing the installation of hardware and software components. See Services.
OpenPolScope Software
The OpenPolScope software synchronizes the LC or filter wheel settings and image acquisitions, calculates the fluorescence, anisotropy, and polarization orientation for each resolved image point, and presents the results as images.
Fluorescence is one of three imaging modes of the OpenPolScope software which is built as Micro-Manager and ImageJ plugins.
Pol-Acquisition is a Micro-Manager plugin and is used for acquiring images.
Pol-Analyzer is an ImageJ plugin and is used for viewing
and
reprocessing data. The Pol-Analyzer plugin requires Micro-Manager to be
installed for reading image data previously acquired using Pol-Acquisition.
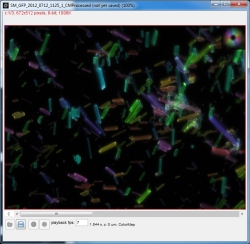
The fluorescence intensity is measured as a function of the polarization orientation of the excitation light. The fluorescence itself is not analyzed for its polarization; there is no polarization analyzer in the imaging path. The mean fluorescence is the average over all polarization orientations. The differential fluorescence is measured either as anisotropy, or the ratio of maximum to minimum fluorescence, or simply the difference between maximum and minimum fluorescence. The orientation of maximum fluorescence is given as an angle to the horizontal reference axis in the image. The OpenPolScope software calculates all three quantities for every resolved specimen point and presents the results of the computations as images. Below are images of fluorescent GFP crystals.
The fluorescence image identifies areas that exhibit fluorescence. The fluorescence intensity is averaged over all polarization directions
In the anisotropy image, dark areas correspond to sample regions that have no or little anisotropic fluorescence. Bright areas, on the other hand, correspond to sample regions with highly polarized fluorescence.
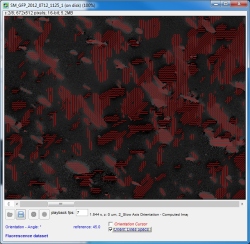
In the orientation image, each pixel value gives the orientation of the excitation polarization that yields maximum fluorescence. The orientation is given as an angle between 0° and 180° with respect to the
horizontal axis in the image. Red orientation lines can be drawn as an overlay on any of the images.
Examples
GFP Crystals: Polarized Fluorescence of needle-shaped  GFP crystals revealed by false color. The fluorescence of the crystals is strongly polarized parallel to the needle axis. Hue in this color image represents the polarization orientation with maximum fluorescence. Purified GFP extracted from the jellyfish Aequorea was generously provided by Osamu Shimomura and crystals were prepared by Naoki Noda, following the description given by Inoué et al. (Inoue, S., O. Shimomura, M. Goda, M. Shribak and P. T. Tran. 2002. Polarized Fluorescence of green fluorescence protein. Proc Natl Acad Sci U S A 99: 4272-7.)
 Septin-GFP constructs in MDCK Cell: Fluorescence image of a living cell (MDCK) expressing septin molecules linked to green fluorescent protein (GFP). The image was recorded with the Fluorescence LC-PolScope which reveals the polarized fluorescence of septin fibers in false color. Each hue is associated with a different orientation of the GFP dipoles, which in turn reflect the fiber orientation, as septin-GFP molecules are locked into the fiber assembly. The white color of the fluorescence from the cytosol, on the other hand, reveals the lack of a common alignment of septin-GFP molecules suspended in the cytosol. Credit: Bradley DeMay and Amy Gladfelter, Dartmouth College.


